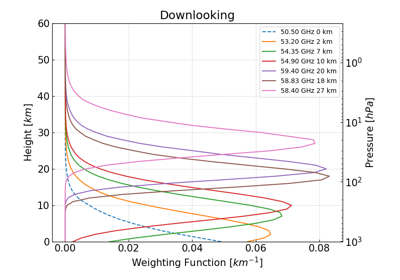
pyrtlib.weighting_functions.WeightingFunctions.plot_wf_grouped#
- WeightingFunctions.plot_wf_grouped(wgt: ndarray, title: Optional[str] = '', ylim: Optional[Tuple[int, int]] = None, grouped_frequencies: List[int] = None, grouped_labels: List[str] = None, **kwargs) None#
Plot the weighting functions
- Parameters:
wgt (ndarray) – The weighting functions to be plotted.
title (Optional[str], optional) – The title of the plot. Defaults to ‘’.
ylim (Optional[Tuple[int, int]], optional) – The y-axis limits of the plot. Defaults to None.
grouped_frequencies (List[int]) – The number of frequencies to be grouped.
grouped_labels (List[str]) – The labels for the grouped frequencies.
dpi (Optional[int], optional) – The dpi of the plot. Defaults to 150.
**kwargs – Additional keyword arguments (figsize, dpi)
- Raises:
ValueError – If the plot is not available for the current satellite mode.

