Note
Go to the end to download the full example code.
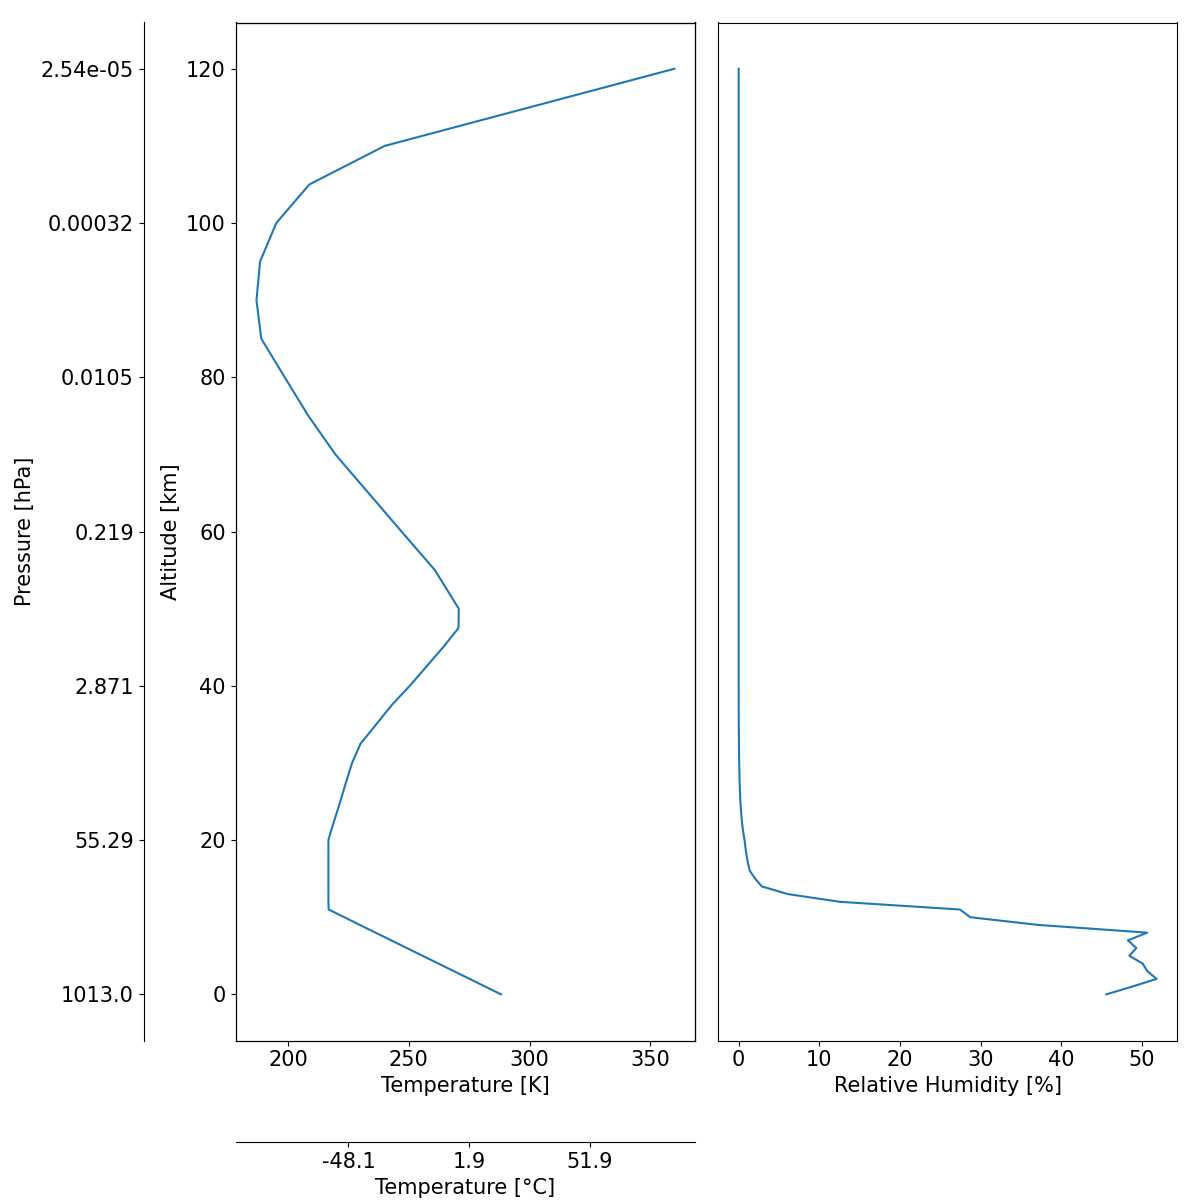
Atmospheric Profiles#
This example shows how to use the
pyrtlib.climatology.AtmosphericProfiles method to generate temperature and relative humidity profiles
import matplotlib.pyplot as plt

plt.rcParams.update({'font.size': 15})
import matplotlib.ticker as ticker
from matplotlib.ticker import ScalarFormatter
import numpy as np

from pyrtlib.climatology import AtmosphericProfiles as atmp
from pyrtlib.utils import ppmv2gkg, mr2rh, height_to_pressure


def tick_function(x):
    v = x - 273.15
    return ["%.1f" % z for z in v]


def tick_function_pressure(p, z, ticks):
    values = []
    for tick in ticks:
        v = p[np.where(z==tick)]
        values.append(v[0])
    return values


z, p, d, t, md = atmp.gl_atm(atmp.US_STANDARD)

gkg = ppmv2gkg(md[:, atmp.H2O], atmp.H2O)
rh = mr2rh(p, t, gkg)[0] / 100

fig, ax = plt.subplots(1, 2, figsize=(12, 12))
ax1 = ax[0].twiny()

ax[1].yaxis.set_label_position("right")
ax[1].yaxis.tick_right()
ax[1].yaxis.set_major_formatter(ScalarFormatter())
ax[1].yaxis.set_major_formatter(ticker.FuncFormatter(lambda y, _: '{:g}'.format(y)))

fig.subplots_adjust(bottom=0.2)

ax[0].plot(t, z)
ax[1].plot(rh * 100, z)
ax[0].set_xlabel("Temperature [K]")
ax[1].set_xlabel("Relative Humidity [%]")
ax[1].axes.get_yaxis().set_visible(False)
ax[0].set_ylabel("Altitude [km]")

new_tick_locations_pressure = np.arange(0, 140, 20)
ax3 = ax[0].twinx()
rspine = ax3.spines['left'].set_position(('axes', -0.2))
ax3.yaxis.set_ticks_position("left")
ax3.yaxis.set_label_position("left")
ax3.set_frame_on(True)
ax3.patch.set_visible(False)
ax3.set_ylabel('Pressure [hPa]')
ax3.set_yticks(new_tick_locations_pressure)
ax3.set_yticklabels(tick_function_pressure(p, z, new_tick_locations_pressure))
ax3.set_ylim(ax[1].get_ylim())

new_tick_locations = np.arange(175, 400, 50)

ax1.xaxis.set_ticks_position("bottom")
ax1.xaxis.set_label_position("bottom")

# Offset the twin axis below the host
ax1.spines["bottom"].set_position(("axes", -0.1))
ax1.set_frame_on(True)
ax1.patch.set_visible(False)

ax1.spines["bottom"].set_visible(True)

ax1.set_xticks(new_tick_locations)
ax1.set_xticklabels(tick_function(new_tick_locations))
ax1.set_xlabel("Temperature [°C]")
ax1.set_xlim(ax[0].get_xlim())
fig.tight_layout()
Total running time of the script: (0 minutes 0.194 seconds)