Note
Go to the end to download the full example code.
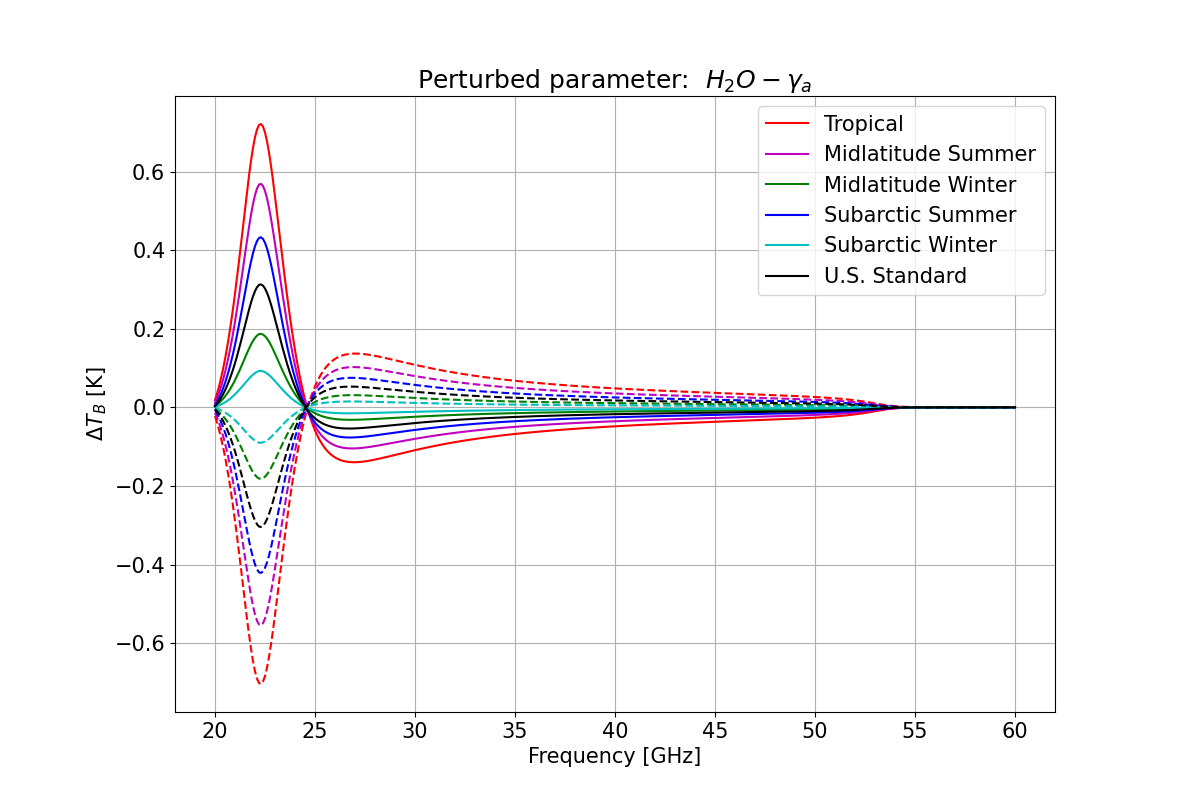
Performing sensitivity of spectroscopic parameters#
This example shows how to use the
pyrtlib.tb_spectrum.TbCloudRTE method to calculate sensitivity of simulated downwelling brightness temperature
with a perturbed water vapor absorption parameter (\(\gamma_a\) air broadening 22 GHz) from [Cimini-2018].
import matplotlib.pyplot as plt
import numpy as np
plt.rcParams.update({'font.size': 15})

from pyrtlib.climatology import AtmosphericProfiles as atmp
from pyrtlib.tb_spectrum import TbCloudRTE
from pyrtlib.absorption_model import H2OAbsModel, O2AbsModel
from pyrtlib.uncertainty import AbsModUncertainty, SpectroscopicParameter
from pyrtlib.utils import ppmv2gkg, mr2rh

atm = ['Tropical',
       'Midlatitude Summer',
       'Midlatitude Winter',
       'Subarctic Summer',
       'Subarctic Winter',
       'U.S. Standard']

colors = ["r", "m", "g", "b", "c", "k"]

fig, ax = plt.subplots(1, 1, figsize=(12, 8))
ax.set_xlabel('Frequency [GHz]')
ax.set_ylabel('$\Delta {T_B}$ [K]')
for i in range(0, 6):

    z, p, d, t, md = atmp.gl_atm(i)

    gkg = ppmv2gkg(md[:, atmp.H2O], atmp.H2O)
    rh = mr2rh(p, t, gkg)[0] / 100

    interp = .1
    frq = np.arange(20, 60 + interp, interp)

    parameters = {**SpectroscopicParameter.water_parameters('R17'), **SpectroscopicParameter.oxygen_parameters('R18')}
    parameters['gamma_a'].value[0] = 2.688
    parameters['gamma_a'].uncer[0] = 0.039
    SpectroscopicParameter.set_parameters(parameters)

    rte = TbCloudRTE(z, p, t, rh, frq, amu=parameters)
    rte.init_absmdl('R17')
    O2AbsModel.model = 'R18'
    O2AbsModel.set_ll()
    rte.satellite = False
    df = rte.execute()

    parameters = AbsModUncertainty.parameters_perturbation(['gamma_a'], 'max', index=0)
    rte.set_amu(parameters)
    df_gamma = rte.execute()
    df['delta_max_gamma_a'] = df_gamma.tbtotal - df.tbtotal

    parameters = AbsModUncertainty.parameters_perturbation(['gamma_a'], 'min', index=0)
    rte.set_amu(parameters)
    df_gamma = rte.execute()
    df['delta_min_gamma_a'] = df_gamma.tbtotal - df.tbtotal

    df = df.set_index(frq)

    df.delta_max_gamma_a.plot(ax=ax, style='--', label='_nolegend_', color=colors[i])
    df.delta_min_gamma_a.plot(ax=ax, label='{}'.format(atm[i]), color=colors[i])

    ax.legend()
    ax.set_box_aspect(0.7)

ax.grid(True, 'both')
plt.title("Perturbed parameter: $\ H_2O - \gamma_a$")
plt.show()
/home/runner/work/pyrtlib/pyrtlib/docs/script_examples/plot_brightness_temperature_uncertainties.py:32: SyntaxWarning: invalid escape sequence '\D'
  ax.set_ylabel('$\Delta {T_B}$ [K]')
/home/runner/work/pyrtlib/pyrtlib/docs/script_examples/plot_brightness_temperature_uncertainties.py:74: SyntaxWarning: invalid escape sequence '\ '
  plt.title("Perturbed parameter: $\ H_2O - \gamma_a$")
Solid lines correspond to negative perturbation (value − uncertainty), while dashed lines correspond to positive perturbation (value + uncertainty).
Total running time of the script: (1 minutes 21.230 seconds)