Note
Go to the end to download the full example code.
Performing Upwelling Brightness Temperature calculation using IGRA2 Upper Air Observations (with Extrapolation).#
This example shows how to use the
pyrtlib.tb_spectrum.TbCloudRTE method to calculate brightness temperature from satellite (upwelling) using
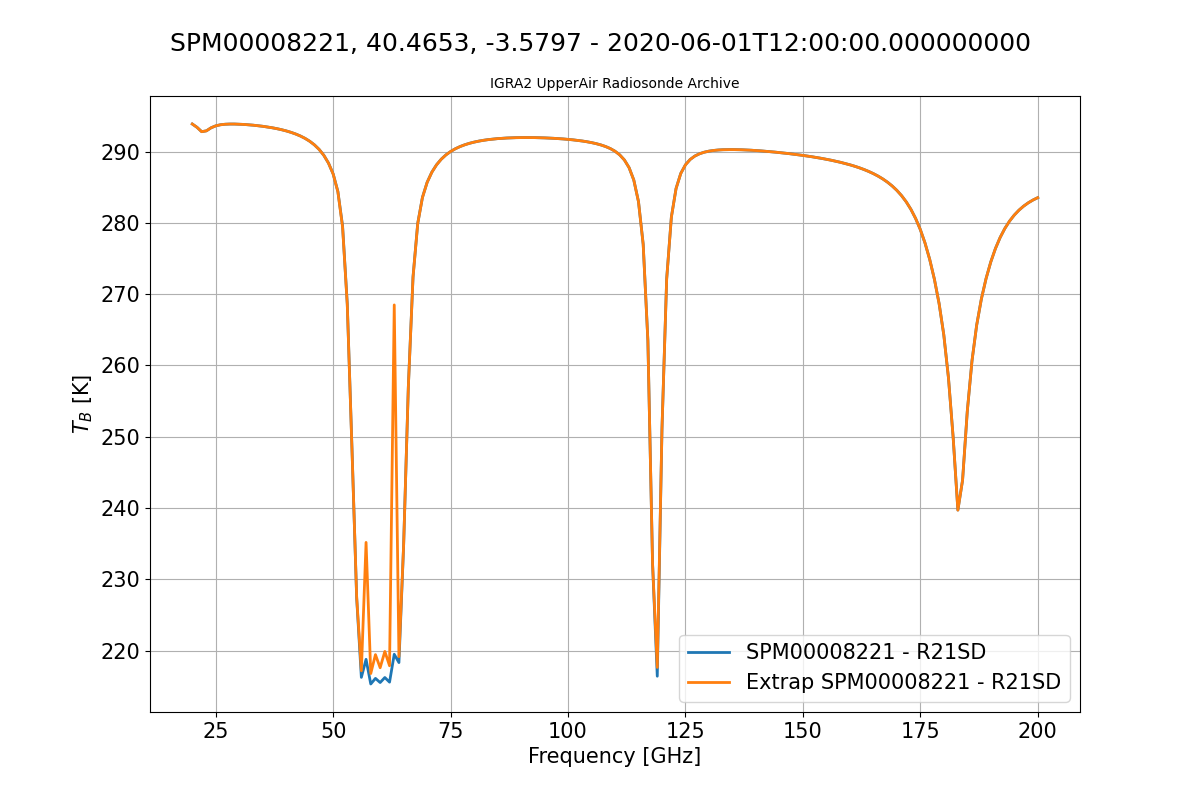
observations from IGRA2 Upper Air Archive and comparison of BT with the extrapoletd profile.
import numpy as np
from datetime import datetime

import matplotlib.pyplot as plt
plt.rcParams.update({'font.size': 15})

from pyrtlib.tb_spectrum import TbCloudRTE
from pyrtlib.climatology import ProfileExtrapolation
from pyrtlib.utils import dewpoint2rh, to_kelvin
from pyrtlib.absorption_model import H2OAbsModel
from pyrtlib.apiwebservices import IGRAUpperAir

date = datetime(2020, 6, 1, 12)
station = 'SPM00008221'
df_igra2, header = IGRAUpperAir.request_data(date, station)

df_igra2 = df_igra2[df_igra2.pressure.notna() &
                    df_igra2.temperature.notna() &
                    df_igra2.dewpoint.notna() &
                    df_igra2.height.notna()]

z, p, t = df_igra2.height.values / 1000, df_igra2.pressure.values, to_kelvin(df_igra2.temperature.values)

rh = dewpoint2rh(df_igra2.dewpoint, df_igra2.temperature).values

mdl = 'R21SD'
frq = np.arange(20, 201, 1)
nf = len(frq)

rte = TbCloudRTE(z, p, t, rh, frq)
rte.init_absmdl('R20')
H2OAbsModel.model = 'R21SD'
H2OAbsModel.set_ll()
df = rte.execute()
df = df.set_index(frq)
/home/runner/work/pyrtlib/pyrtlib/pyrtlib/tb_spectrum.py:82: UserWarning: Number of levels too low (14) or minimum pressure value lower than 10 hPa (20.0). Please considering profile extrapolation. Levels number must be higher than 25 and pressure value lower than 10 hPa
  warnings.warn(f"Number of levels too low ({len(self.p)}) or "
Extrapolation of profile
/home/runner/work/pyrtlib/pyrtlib/pyrtlib/climatology/extrapolation.py:511: RuntimeWarning: overflow encountered in exp
  14.3542 * np.exp(-0.4174 * h - 0.02290 * h**2 +
Plotting
fig, ax = plt.subplots(1, 1, figsize=(12, 8))
plt.suptitle("{}, {}, {} - {}".format(header.site_id.values[0], header.latitude.values[0], header.longitude.values[0], header.date.values[0]), y=0.96)
plt.title("IGRA2 UpperAir Radiosonde Archive", fontsize=10, ha='center')
ax.set_xlabel('Frequency [GHz]')
ax.set_ylabel('${T_B}$ [K]')
df.tbtotal.plot(ax=ax, linewidth=2, label='{} - {}'.format(header.site_id.values[0], mdl))
dff.tbtotal.plot(ax=ax, linewidth=2, label='Extrap {} - {}'.format(header.site_id.values[0], mdl))
ax.grid(True, 'both')
ax.legend()
plt.show()

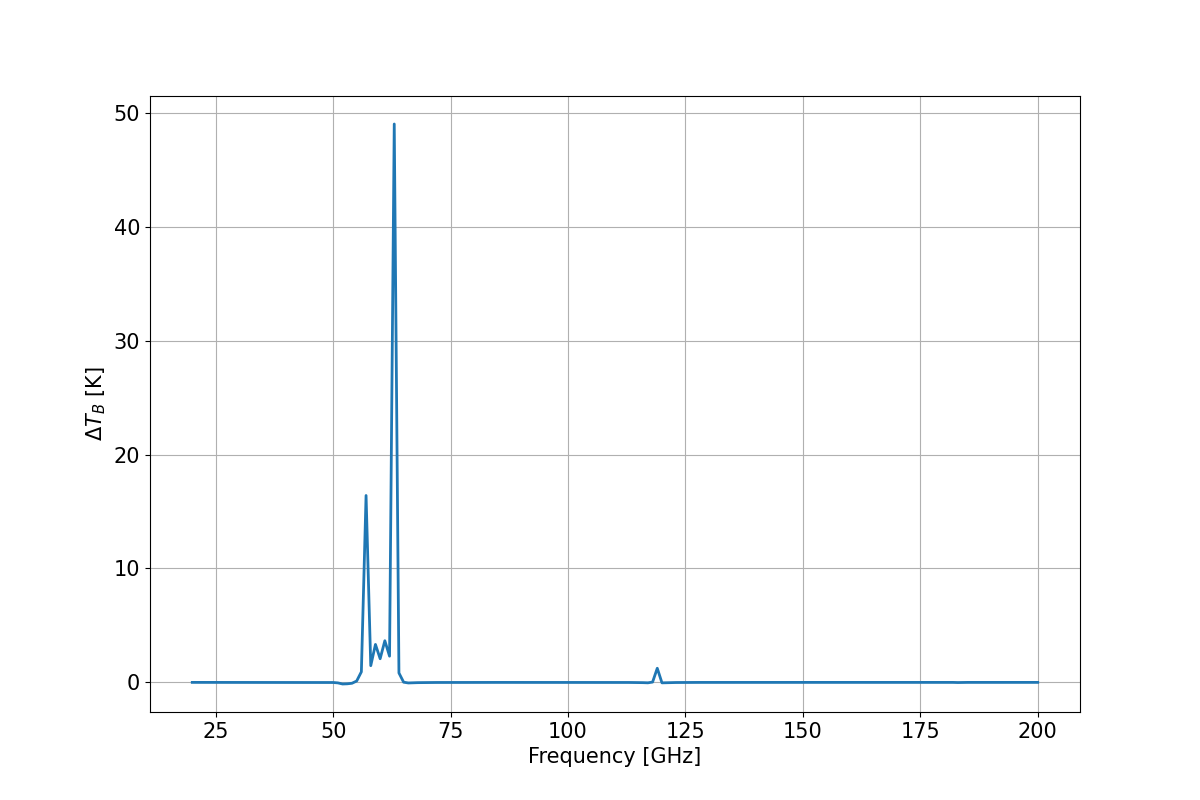
Difference BT
df['delta'] = dff.tbtotal - df.tbtotal
df.delta.plot(linewidth=2, xlabel='Frequency [GHz]', ylabel='$\Delta T_B$ [K]', grid=True, figsize=(12, 8))

/home/runner/work/pyrtlib/pyrtlib/docs/script_examples/plot_bt_igra2.py:76: SyntaxWarning: invalid escape sequence '\D'
  df.delta.plot(linewidth=2, xlabel='Frequency [GHz]', ylabel='$\Delta T_B$ [K]', grid=True, figsize=(12, 8))

<Axes: xlabel='Frequency [GHz]', ylabel='$\\Delta T_B$ [K]'>
Total running time of the script: (0 minutes 8.480 seconds)
