Note
Go to the end to download the full example code.
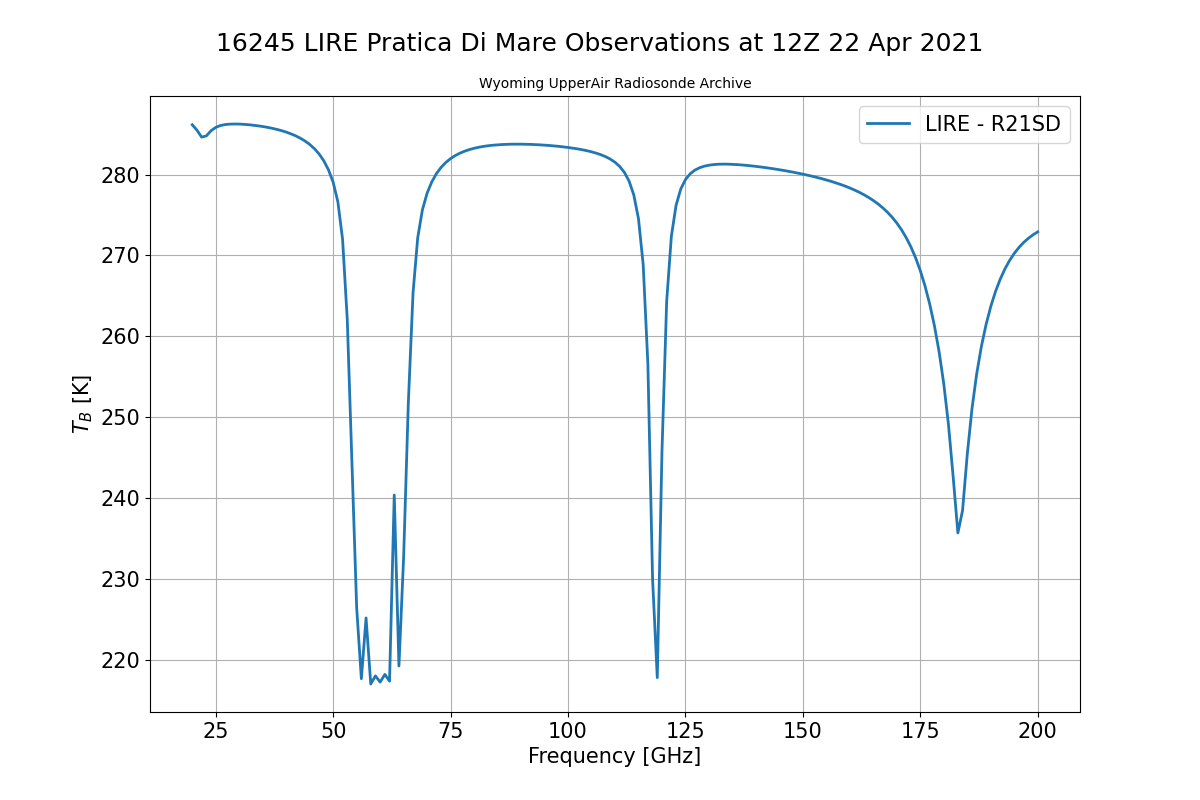
Performing Upwelling Brightness Temperature calculation using Wyoming Upper Air Observations.#
This example shows how to use the
pyrtlib.tb_spectrum.TbCloudRTE method to calculate brightness temperature from satellite (upwelling) using
observations from Wyoming Upper Air Archive.
import matplotlib.pyplot as plt

plt.rcParams.update({'font.size': 15})
import numpy as np
from datetime import datetime

from pyrtlib.tb_spectrum import TbCloudRTE
from pyrtlib.utils import dewpoint2rh, import_lineshape, to_kelvin
from pyrtlib.absorption_model import H2OAbsModel
from pyrtlib.apiwebservices import WyomingUpperAir

date = datetime(2021, 4, 22, 12)
station = 'LIRE'
df_w = WyomingUpperAir.request_data(date, station)

z, p, t, q = df_w.height.values / 1000, \
               df_w.pressure.values, \
               to_kelvin(df_w.temperature.values), \
               df_w.mixr.values

rh = dewpoint2rh(df_w.dewpoint, df_w.temperature).values

mdl = 'R21SD'
ang = np.array([90.])
frq = np.arange(20, 201, 1)
nf = len(frq)

rte = TbCloudRTE(z, p, t, rh, frq, ang)
rte.init_absmdl('R20')
H2OAbsModel.model = 'R21SD'
H2OAbsModel.h2oll = import_lineshape('h2oll')
df = rte.execute()
df = df.set_index(frq)

fig, ax = plt.subplots(1, 1, figsize=(12, 8))
plt.suptitle(df_w.title[0], y=0.96)
plt.title("Wyoming UpperAir Radiosonde Archive", fontsize=10, ha='center')
ax.set_xlabel('Frequency [GHz]')
ax.set_ylabel('${T_B}$ [K]')
df.tbtotal.plot(ax=ax, linewidth=2, label='{} - {}'.format(df_w.station[0], mdl))
ax.grid(True, 'both')
ax.legend()
plt.show()

/home/runner/work/pyrtlib/pyrtlib/pyrtlib/apiwebservices/wyomingupperair.py:147: FutureWarning: The 'delim_whitespace' keyword in pd.read_csv is deprecated and will be removed in a future version. Use ``sep='\s+'`` instead
  df = pd.read_csv(tabular_data, header=None, skiprows=5, delim_whitespace=True, usecols=[0, 1, 2, 3, 4, 5], names=col_names)
Total running time of the script: (0 minutes 13.930 seconds)
