Note
Go to the end to download the full example code.
Uncertainty Example#
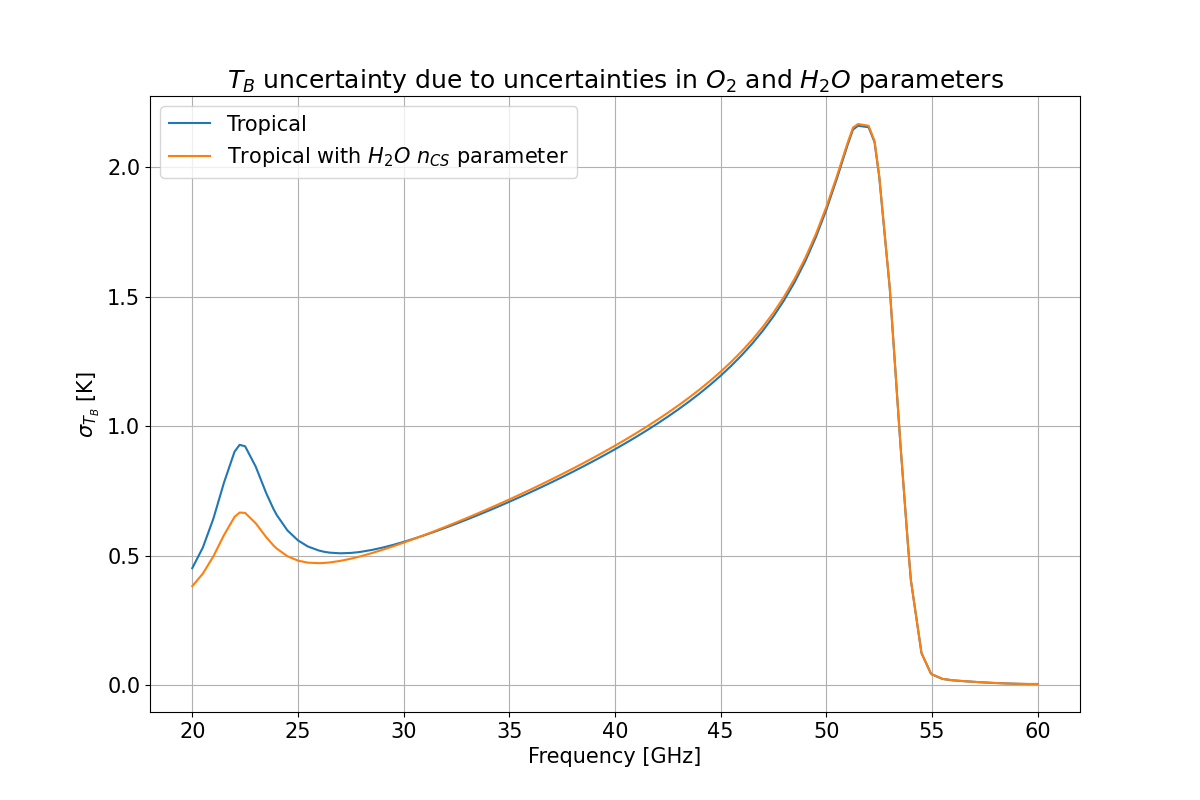
This example shows how to use the uncertainty module by simulating the downwelling brightness temperature and then calculate the uncertainty due to uncertainties in ${O_2}$ and ${H_2 O}$ parameter.
import matplotlib.pyplot as plt

plt.rcParams.update({'font.size': 15})
import matplotlib.ticker as ticker
from matplotlib.ticker import ScalarFormatter
import numpy as np
import pandas as pd
Import pyrtlib package and tools#
from pyrtlib.uncertainty import AbsModUncertainty, SpectroscopicParameter
from pyrtlib.climatology import AtmosphericProfiles as atmp
from pyrtlib.tb_spectrum import TbCloudRTE
from pyrtlib.absorption_model import O2AbsModel
from pyrtlib.utils import ppmv2gkg, mr2rh, get_frequencies, constants
from pyrtlib.uncertainty import covariance_matrix
Define spectroscopic parameters to be perturbed and them uncertainties#
O2_parameters = {
    'O2S': range(1),
    'X05': [None],
    'WB300': [None],
    'O2gamma': range(34),
    'Y300': range(34),
    'O2_V': range(34)
}

HO2_parameters = {
    'con_Cf_factr': [None],
    'con_Cs_factr': [None],
    'gamma_a': range(1),
    'S': range(1),
    'con_Xf': [None],
    'SR': range(1),
    'con_Xs': [None]
}
parameters = {**SpectroscopicParameter.oxygen_parameters('R18'),
              **SpectroscopicParameter.water_parameters('R17')}

parameters['O2S'].uncer = parameters['O2S'].value / 100
parameters['X05'].uncer = 0.05
parameters['WB300'].uncer = 0.05
parameters['O2gamma'].uncer[0: 34] = np.array([0.05, 0.0138964, 0.0138964, 0.0138964, 0.0138964,
                                               0.0138964, 0.0138964, 0.0138964, 0.0138964, 0.0138964,
                                               0.0138964, 0.0138964, 0.0138964, 0.0138964, 0.0138964,
                                               0.0138964, 0.0138964, 0.0138964, 0.0138964, 0.0138964,
                                               0.0138964, 0.01131274, 0.01131274, 0.01453087, 0.01453087,
                                               0.01789881, 0.01789881, 0.02116733, 0.02134575, 0.02476584,
                                               0.02476584, 0.02839177, 0.02839177, 0.03203582])
parameters['Y300'].uncer[0: 34] = np.array([0.01, 0.00404133, 0.00502581, 0.00786035, 0.00820458,
                                            0.00935381, 0.00809901, 0.0078214, 0.00544132, 0.00460658,
                                            0.00225117, 0.00209907, 0.0039399, 0.00484963, 0.00799499,
                                            0.00878031, 0.01202685, 0.01261821, 0.01577055, 0.01615187,
                                            0.01907464, 0.01926978, 0.0218633, 0.02188287, 0.02416567,
                                            0.02401716, 0.02604178, 0.02575469, 0.02762271, 0.02720018,
                                            0.02897909, 0.02843003, 0.03019027, 0.02951218])
parameters['O2_V'].uncer[0: 34] = np.array([0.00288243, 0.04655306, 0.03914166, 0.06110402, 0.0494057,
                                            0.05728709, 0.06444876, 0.07279906, 0.06385863, 0.07007177,
                                            0.05963384, 0.06373721, 0.11789158, 0.12307213, 0.10151855,
                                            0.10427449, 0.08328802, 0.08486523, 0.10130857, 0.10244286,
                                            0.15750036, 0.15814743, 0.24421784, 0.24343211, 0.3084326,
                                            0.30576201, 0.34568212, 0.34107696, 0.36123446, 0.35507902,
                                            0.37305309, 0.36544166, 0.38490936, 0.37583782])

parameters['gamma_a'].uncer[0] = 0.039
parameters['S'].uncer[0] = 0.043 * 1e-25 * constants('light')[0] * 100
parameters['con_Xf'].uncer = 0.8
parameters['SR'].uncer[0] = 0.0014
parameters['con_Xs'].uncer = 0.6

SpectroscopicParameter.set_parameters(parameters)
Load standard atmosphere (low res at lower levels, only 1 level within 1 km) and define which absorption model will be used.#
Use frequencies set of HATPRO Radiometer#
Performing uncertainty of brightness temperature#
Default calculatoin consideres no cloud and no perturbation
rte = TbCloudRTE(z, p, t, rh, frq, amu=parameters)
rte.satellite = False
rte.init_absmdl('R17')
O2AbsModel.model = 'R18'
O2AbsModel.set_ll()
df = rte.execute()
df_out = pd.DataFrame()
df_out['freq'] = frq
df_out['tb'] = df.tbtotal
Calculate Jacobian matrix#
\(Cov(T_{b}) = K_{p} \times Cov(p) \times K_{p}^T\)
cnt = 0
for k, v in (O2_parameters | HO2_parameters).items():
    for i in v:
        amu_p = AbsModUncertainty.parameters_perturbation([k], 'max', index=i)
        rte.set_amu(amu_p)
        df = rte.execute()
        if k =='O2S':
            parameters[k].uncer = parameters[k].uncer / parameters[k].value * 100
        if k in ['con_Cf_factr', 'con_Cs_factr']:
            parameters[k].uncer = parameters[k[0:6]].value * parameters[k].uncer
        field_name = 'p_{}{}'.format(k, '_' + str(i) if i else '')
        delta_tb = df.tbtotal.values - df_out.tb.values
        if i is not None:
            o = pd.Series(delta_tb / parameters[k].uncer[i], name=field_name)
        else:
            o = pd.Series(delta_tb / parameters[k].uncer, name=field_name)
        df_out = pd.concat([df_out, o], axis=1)
        cnt += 1
Calculate uncertainty (sigma) for BT#
Using covariance matrix by [Cimini-2018] which identifies 111 parameters (6 for water vapor and 105 for oxygen)
params = df_out.copy()

Kp = df_out.loc[:, ~df_out.columns.isin(['tb', 'freq', 'p_con_Xs'])].values
covtb = np.matmul(np.matmul(Kp, covariance_matrix.R17_111), Kp.T)
sigma_tb = np.sqrt(np.diag(covtb))
params['sigma_tb'] = sigma_tb
Using covariance matrix by [Cimini-2019] which add the \({n_{CS}}\) parameter for water vapour
Kp = df_out.loc[:, ~df_out.columns.isin(['tb', 'freq'])].values
covtb = np.matmul(np.matmul(Kp, covariance_matrix.R17_112), Kp.T)
sigma_tb = np.sqrt(np.diag(covtb))
params['sigma_tb_with_con_Xs'] = sigma_tb
params.plot(x='freq', y=['sigma_tb', 'sigma_tb_with_con_Xs'],
            title="${T_B}$ uncertainty due to uncertainties in ${O_2}$ and ${H_2 O}$ parameters",
            xlabel='Frequency [GHz]', ylabel='$\sigma_{T_B}$ [K]',
            label=[atmp.atm_profiles()[atmp.TROPICAL],
                   atmp.atm_profiles()[atmp.TROPICAL] + ' with ${H_2 O}$ ${n_{CS}}$ parameter'],
                   figsize=(12,8))
plt.grid()

/home/runner/work/pyrtlib/pyrtlib/docs/script_examples/uncertainty_tutorial.py:180: SyntaxWarning: invalid escape sequence '\s'
  xlabel='Frequency [GHz]', ylabel='$\sigma_{T_B}$ [K]',
Total running time of the script: (4 minutes 23.812 seconds)
