Note
Go to the end to download the full example code.
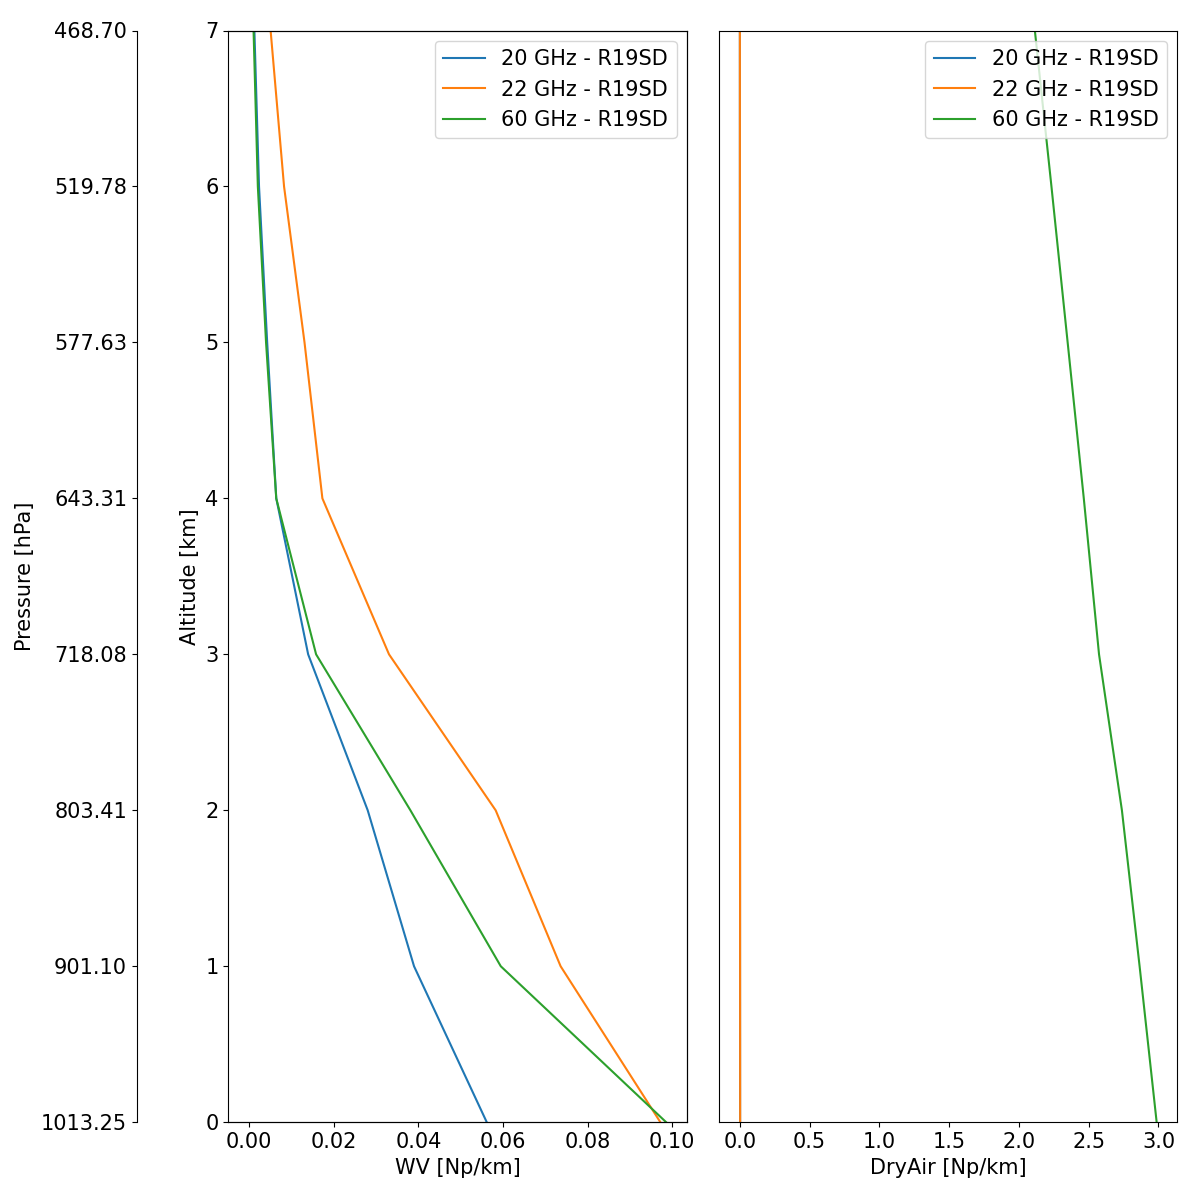
Water Vapour Absorption Profiles#
This example shows how to use the
pyrtlib.rt_equation.RTEquation.clearsky_absorption() method to generate water vapor absorption profil and
dry air absorption profile using R16 model.
import matplotlib.pyplot as plt

plt.rcParams.update({'font.size': 15})
import matplotlib.ticker as ticker
from matplotlib.ticker import ScalarFormatter
import numpy as np

from pyrtlib.rt_equation import RTEquation
from pyrtlib.absorption_model import H2OAbsModel, O2AbsModel, AbsModel
from pyrtlib.climatology import AtmosphericProfiles as atmp
from pyrtlib.utils import ppmv2gkg, mr2rh, import_lineshape, height_to_pressure

z, p, d, t, md = atmp.gl_atm(atmp.TROPICAL)
frq = np.arange(20, 61, 1)
ice = 0
gkg = ppmv2gkg(md[:, atmp.H2O], atmp.H2O)
rh = mr2rh(p, t, gkg)[0] / 100

e, rho = RTEquation.vapor(t, rh, ice)

mdl = 'R19SD'
AbsModel.model = mdl
H2OAbsModel.h2oll = import_lineshape('h2oll')
O2AbsModel.o2ll = import_lineshape('o2ll')

awet = np.zeros((len(frq), len(z)))
adry = np.zeros((len(frq), len(z)))

for j in range(0, len(frq)):
    awet[j, :], adry[j, :] = RTEquation.clearsky_absorption(p, t, e, frq[j])

fig, ax = plt.subplots(1, 2, figsize=(12, 12))
axis_lim = [0, 7]


def tick_function_pressure(x):
    v = height_to_pressure(x * 1000)
    return ["%.2f" % z for z in v]


ax[1].yaxis.set_label_position("right")
ax[1].yaxis.tick_right()
ax[1].yaxis.set_major_formatter(ScalarFormatter())
ax[1].yaxis.set_major_formatter(ticker.FuncFormatter(lambda y, _: '{:g}'.format(y)))

mask = np.isin(frq, [20, 22, 60])
freq = np.nonzero(mask)
for i in freq[0]:
    ax[0].plot(awet[i, :], z, label='{} GHz - {}'.format(frq[i], mdl))
    ax[1].plot(adry[i, :], z, label='{} GHz - {}'.format(frq[i], mdl))

# ax[0].plot(rho, z, label='Vapor density [g/m3]', linestyle='--')

ax[0].set_xlabel("WV [Np/km]")
ax[1].set_xlabel("DryAir [Np/km]")
ax[1].axes.get_yaxis().set_visible(False)
ax[0].set_ylabel("Altitude [km]")

ax[0].set_ylim(axis_lim)
ax[1].set_ylim(axis_lim)

new_tick_locations_pressure = np.arange(0, 120, 1)

ax3 = ax[0].twinx()
rspine = ax3.spines['left'].set_position(('axes', -0.2))
ax3.yaxis.set_ticks_position("left")
ax3.yaxis.set_label_position("left")
ax3.set_frame_on(True)
ax3.patch.set_visible(False)
ax3.set_ylabel('Pressure [hPa]')
ax3.set_yticks(new_tick_locations_pressure)
ax3.set_yticklabels(tick_function_pressure(new_tick_locations_pressure))
ax3.set_ylim(ax[1].get_ylim())

ax[0].legend(loc="upper right")
ax[1].legend(loc="upper right")

fig.tight_layout()
Total running time of the script: (0 minutes 0.874 seconds)