Note
Go to the end to download the full example code.
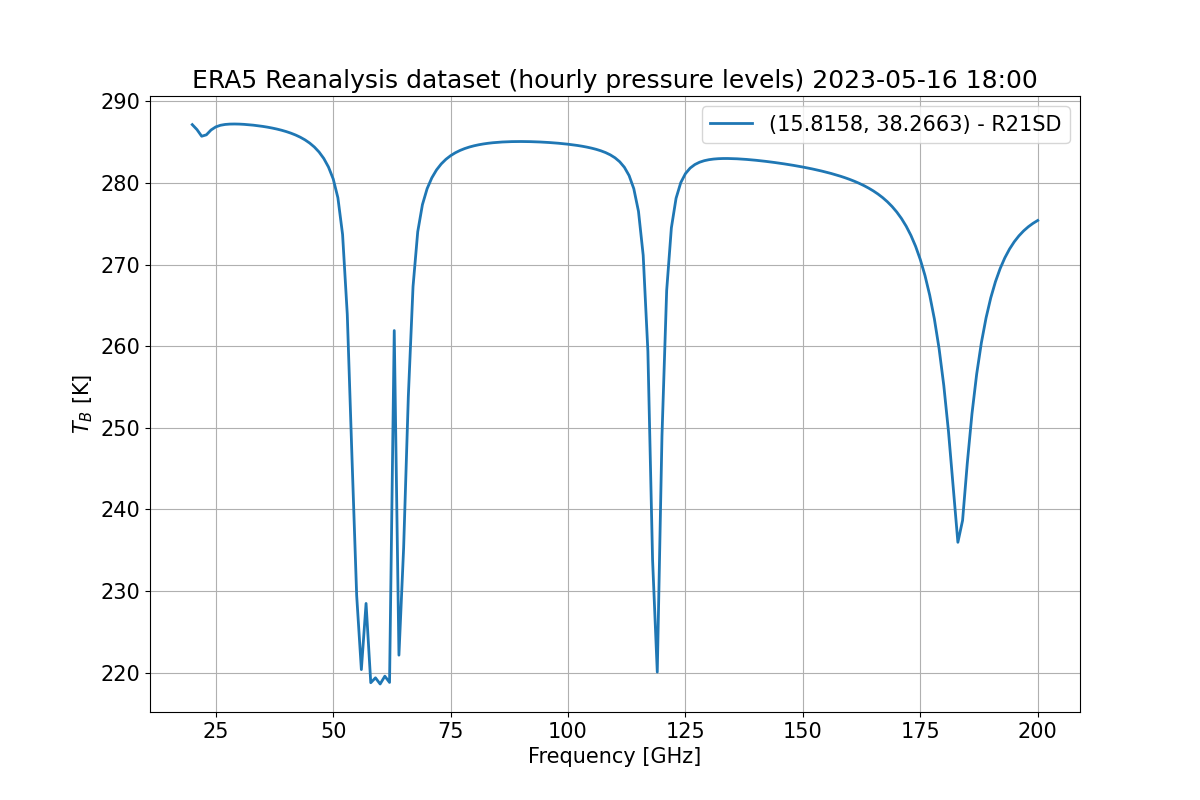
Performing Upwelling Brightness Temperature calculation using ERA5 Reanalysis Observations.#
This example shows how to use the
pyrtlib.tb_spectrum.TbCloudRTE method to calculate brightness temperature from satellite (upwelling) using
observations from ERA5 Reanalysis hourly pressure levels dataset.
import matplotlib.pyplot as plt

plt.rcParams.update({'font.size': 15})
import numpy as np
from pyrtlib.tb_spectrum import TbCloudRTE
from pyrtlib.utils import import_lineshape
from pyrtlib.absorption_model import H2OAbsModel
from pyrtlib.apiwebservices import ERA5Reanalysis

# To request dataset via CDS API
# date = datetime(2020, 2, 22, 12)
# nc_file = ERA5Reanalysis.request_data(tempfile.gettempdir(), date, lonlat)

# Tito Scalo, Potenza, Italy
lonlat = (15.8158, 38.2663)
nc_file = 'era5_reanalysis-2023-05-16T18:00:00.nc'
df_era5 = ERA5Reanalysis.read_data(nc_file, lonlat)

mdl = 'R21SD'
ang = np.array([90.])
frq = np.arange(20, 201, 1)
nf = len(frq)

rte = TbCloudRTE(df_era5.z.values, df_era5.p.values, df_era5.t.values, df_era5.rh.values, frq, ang)
rte.init_absmdl('R20')
H2OAbsModel.model = 'R21SD'
H2OAbsModel.h2oll = import_lineshape('h2oll')
df = rte.execute()
df = df.set_index(frq)

fig, ax = plt.subplots(1, 1, figsize=(12, 8))
plt.title(
    "ERA5 Reanalysis dataset (hourly pressure levels) {}".format(df_era5.time[0].strftime(format='%Y-%m-%d %H:%M')),
    ha='center')
ax.set_xlabel('Frequency [GHz]')
ax.set_ylabel('${T_B}$ [K]')
df.tbtotal.plot(ax=ax, linewidth=2, label='{} - {}'.format(lonlat, mdl))
ax.grid(True, 'both')
ax.legend()
plt.show()
Total running time of the script: (0 minutes 2.487 seconds)