Note
Go to the end to download the full example code.
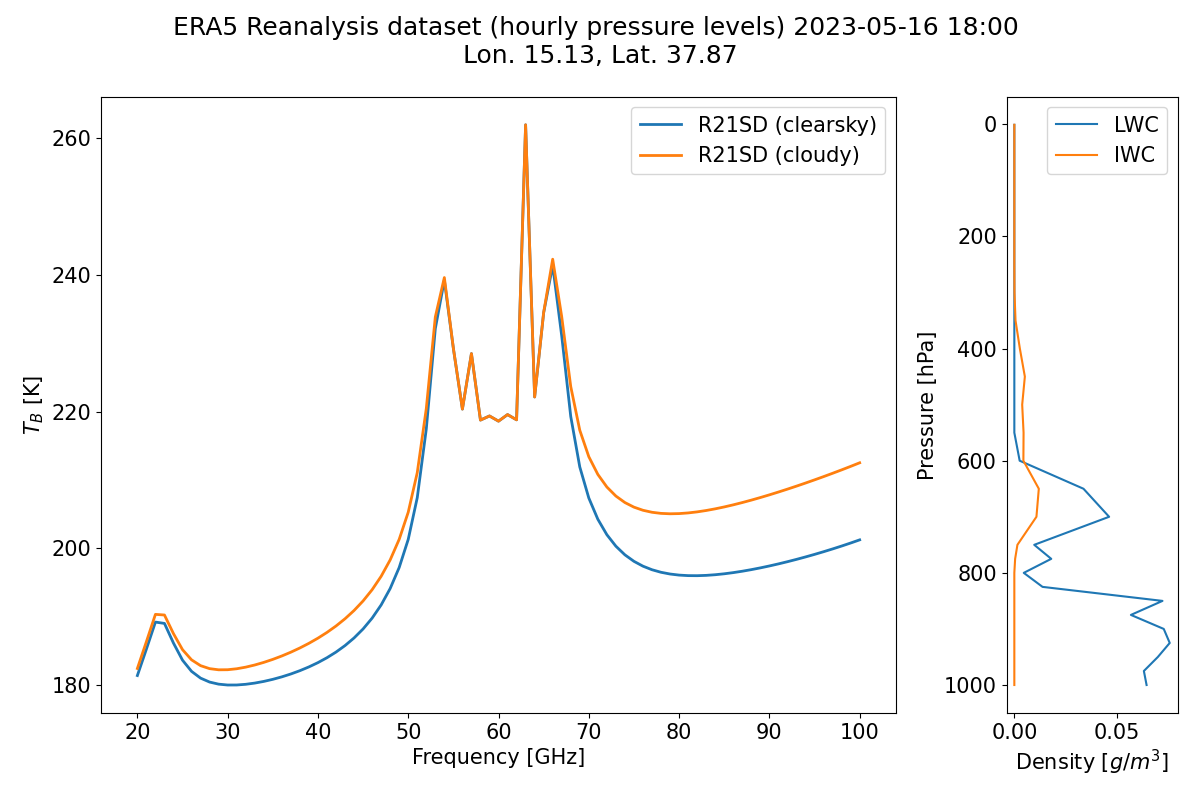
Performing Upwelling Brightness Temperature calculation using ERA5 Reanalysis Observations in cloudy condition.#
This example shows how to use the
pyrtlib.tb_spectrum.TbCloudRTE method to calculate brightness temperature from satellite (upwelling) using
observations from ERA5 Reanalysis hourly pressure levels dataset in cloudy condition.
import matplotlib.pyplot as plt
import matplotlib.gridspec as gridspec

plt.rcParams.update({'font.size': 15})
import numpy as np
from pyrtlib.tb_spectrum import TbCloudRTE
from pyrtlib.utils import import_lineshape, kgkg_to_kgm3
from pyrtlib.absorption_model import H2OAbsModel
from pyrtlib.apiwebservices import ERA5Reanalysis

# To request dataset via CDS API
# date = datetime(2020, 2, 22, 12)
# nc_file = ERA5Reanalysis.request_data(tempfile.gettempdir(), date, lonlat)

lonlat = (15.13, 37.87)
nc_file = 'era5_reanalysis-2023-05-16T18:00:00.nc'
df_era5 = ERA5Reanalysis.read_data(nc_file, lonlat)

mdl = 'R21SD'
ang = np.array([90.])
frq = np.arange(20, 101, 1)
nf = len(frq)

cldh = np.empty((2, 1))
cldh[:, 0] = np.array([np.min(df_era5.z), np.max(df_era5.z)])

total_mass = 1 - df_era5.ciwc.values - df_era5.clwc.values - df_era5.crwc.values - df_era5.cswc.values
denice = df_era5.ciwc.values * (1/total_mass) * kgkg_to_kgm3(df_era5.q.values * (1/total_mass),
                                            df_era5.p.values, df_era5.t.values) * 1000
denliq = df_era5.clwc.values * (1/total_mass) * kgkg_to_kgm3(df_era5.q.values * (1/total_mass),
                                            df_era5.p.values, df_era5.t.values) * 1000

fig = plt.figure(figsize=(12, 8))
gs = gridspec.GridSpec(1, 3,
                       width_ratios=[3, 1, 1],
                       height_ratios=[4],
                       hspace=0, wspace=0.4)
ax1 = plt.subplot(gs[:, :-1])
ax2 = plt.subplot(gs[:, 2])

fig.suptitle("ERA5 Reanalysis dataset (hourly pressure levels) {0} \nLon. {1[0]}, Lat. {1[1]}"
             .format(df_era5.time[0].strftime(format='%Y-%m-%d %H:%M'), lonlat), ha='center')
ax1.set_xlabel('Frequency [GHz]')
ax1.set_ylabel('${T_B}$ [K]')

rte = TbCloudRTE(df_era5.z.values, df_era5.p.values, df_era5.t.values, df_era5.rh.values, frq, ang)
rte.init_absmdl('R20')
H2OAbsModel.model = 'R21SD'
H2OAbsModel.h2oll = import_lineshape('h2oll')
for cloudy in [False, True]:
    rte.cloudy = cloudy
    rte.emissivity = 0.6
    rte.init_cloudy(cldh, denice, denliq)
    df = rte.execute()
    df = df.set_index(frq)
    c = '(cloudy)' if cloudy else '(clearsky)'
    df.tbtotal.plot(ax=ax1, linewidth=2, label='{} {}'.format(mdl, c))

ax2.set_xlabel('Density [$g/m^3$]')
ax2.set_ylabel('Pressure [hPa]')
ax2.plot(denliq, df_era5.p.values, label='LWC')
ax2.plot(denice, df_era5.p.values, label='IWC')
ax2.invert_yaxis()

ax1.legend()
ax2.legend()

gs.tight_layout(fig)
plt.show()
/home/runner/work/pyrtlib/pyrtlib/pyrtlib/tb_spectrum.py:221: UserWarning: It seems that TbCloudRTE.cloudy attribute is not set to True. Sets it to True for running model in cloudy condition.
  warnings.warn("It seems that TbCloudRTE.cloudy attribute is not set to True. "
Total running time of the script: (0 minutes 2.378 seconds)