Note
Go to the end to download the full example code.
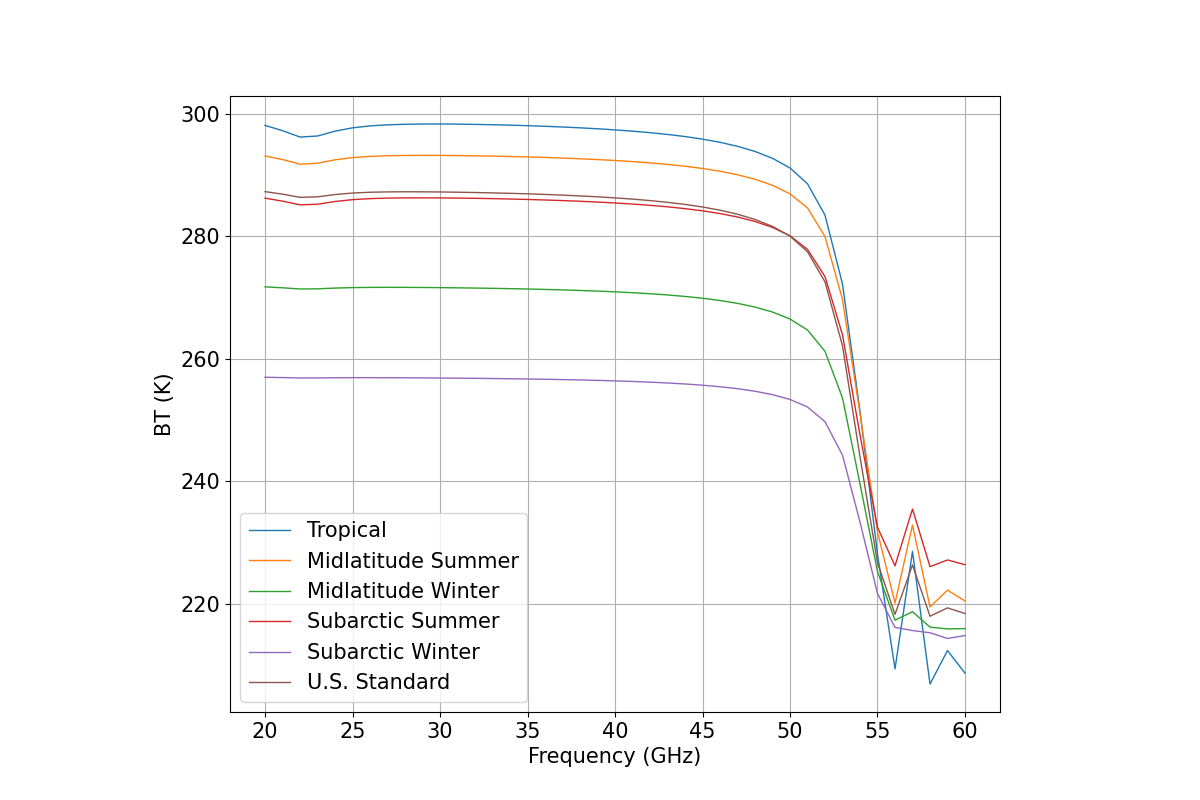
Performing Upwelling Brightness Temperature calculation#
This example shows how to use the
pyrtlib.tb_spectrum.TbCloudRTE method to calculate zenith upwelling brightness temperature
for six reference atmosphere climatology with the R19SD model.
import matplotlib.pyplot as plt

plt.rcParams.update({'font.size': 15})
import numpy as np

from pyrtlib.climatology import AtmosphericProfiles as atmp
from pyrtlib.tb_spectrum import TbCloudRTE
from pyrtlib.utils import ppmv2gkg, mr2rh

atm = ['Tropical',
       'Midlatitude Summer',
       'Midlatitude Winter',
       'Subarctic Summer',
       'Subarctic Winter',
       'U.S. Standard']

fig, ax = plt.subplots(1, 1, figsize=(12, 8))

for i in range(0, 6):
    z, p, d, t, md = atmp.gl_atm(i)
    gkg = ppmv2gkg(md[:, atmp.H2O], atmp.H2O)
    rh = mr2rh(p, t, gkg)[0] / 100

    mdl = 'R19SD'

    ang = np.array([90.])
    frq = np.arange(20, 61, 1)
    nf = len(frq)

    ax.set_xlabel('Frequency (GHz)')
    ax.set_ylabel('BT (K)')

    rte = TbCloudRTE(z, p, t, rh, frq, ang)
    rte.init_absmdl(mdl)
    df = rte.execute()

    df = df.set_index(frq)
    df.tbtotal.plot(ax=ax, linewidth=1, label='{}'.format(atm[i]))

ax.grid(True, 'both')
ax.legend()
ax.set_box_aspect(0.8)
plt.show()
Total running time of the script: (0 minutes 3.965 seconds)